Creating benchmarks to accurately measure your content’s effectiveness is never easy, but what if you had a score that helped you measure your content in a very real, quantitative way?
ContentWRX can help you do just that.
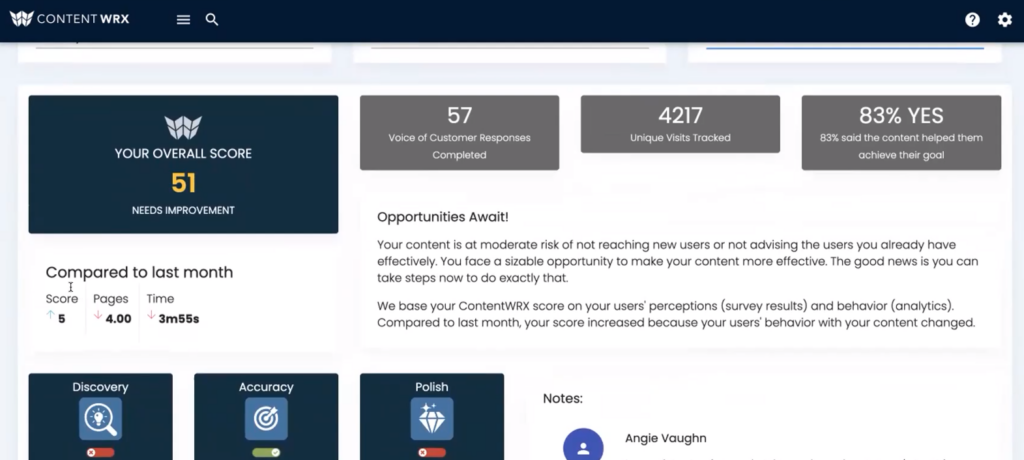
This content effectiveness tool goes beyond analytics and reporting visitor behavior. ContentWRX combines both information from analytics and feedback from visitors to create a score that you can use to gauge your current state of content effectiveness.

This creates a solid benchmark (in the form of your ContentWRX score) for content performance, which can help evaluate whether your content efforts are making an impact. Here’s how it works:
Your ContentWRX score is automatically generated based on a combination of user perceptions of six dimensions of content effectiveness and analytics on your website (such as time on page, pages per visit, etc.). Generally, the more favorable the responses are to each dimension, the higher your score will be.
These six dimensions are:
-
- Discovery: How do users discover content? Do users find the content they need?
- Accuracy: Do they perceive the content as accurate?
- Polish: Do users perceive the formatting and design of the content to be a high level of quality?
- Relevance: Do they perceive the content as serving their needs or interests?
- Usefulness: Does the content anticipate the users’ needs and enable them to complete the goals?
- Influence: Do users take action or make a decision after viewing the content?
A high score reflects high perceptions of your content across these six dimensions. However, if you have a low score, your content needs improvement. It may lack quality or it may not have met the needs of your visitors.
But, the accuracy of your score also depends on the purposes and goals of your content. Don’t worry, ContentWRX has several different evaluations you can use to be sure that you are getting the evaluations most relevant to you and your business. These evaluations include:
- Expertise: This evaluation assesses the content you share to educate users and to position your company as a trusted expert.
- Sales: This evaluation assesses the content users use to learn about you and your products and services.
- Service: This evaluation assesses the content that explains your policies and answers basic customer service questions.
- Support: This evaluation assesses the content that helps your users troubleshoot problems or answer technical questions.
Each evaluation asks visitors a different set of questions. For example, you can use the Expertise evaluation to gauge whether or not your company is seen as a leader or influencer in your industry. You can use the Sales evaluation to gauge whether or not your sales content is effective in answering your visitor’s questions. (Worth noting: This is hardly a complete list, so be sure to check out ContentWRX.com for a full list of its capabilities.)
Putting it simply: When using ContentWRX, you first choose the evaluation that most closely fits the purpose of your content. Then, once you’ve installed ContentWRX and have begun to collect answers from users, ContentWRX will turn that data into your content effectiveness score.
Now, let’s take a closer look at how to analyze your ContentWRX score and set a benchmark for content effectiveness.
Breaking Down the Numbers
As noted above, your ContentWRX score is generated using a combination of web analytics and user perceptions of your content across the six dimensions of content effectiveness. But what does that mean? And how do the numbers break down?
Measured on a scale of 0 to 100, your ContentWRX score measures the extent to which your content fulfills the goals you’ve set for it, whether that’s establishing your expertise, aiding sales, or anything in between.
A score above 80 means that your content is working well and meeting the needs of your users. A score between 60 and 80 indicates that your content is at moderate risk of not meeting your goals. Any score below a 60 means that you have a significant opportunity to improve your content to better serve your user’s needs and accomplish your own business objectives.
Compare Your Content to Competitors and Similar Content
You can also use ContentWRX to measure your content against competitive and content class benchmarks. For example, imagine a company’s content is scored at 11 points higher than others in its industry. This means that this content compares very favorably to that of other companies within this industry.
It’s important to understand how your users perceive content within the industry as a whole, including that of your content competitors. This comparison helps you understand the yardstick by which you should be measuring your content.
The industry benchmark is generated using a few methods. First, if there are multiple clients in the same industry that use ContentWRX, this data is pulled to create an average industry score. The second option takes information gathered from users to evaluate competitor sites.
The “Best of Content Class” comparison tool is another useful aspect of the ContentWRX platform. This tool takes the average scores of all other ContentWRX users measuring the effectiveness of the same type of content you are, whether it’s Sales, Expertise, Support, etc. As a ContentWRX user, you’ll have access to this data, so you are able to compare your scores to others with similar content goals. This will help you understand how your content performs compared to similar content and takes the guesswork out of determining whether your content is having an impact on your audience.
Using these comparisons as a benchmark, you can see how your content stacks up.
Finding Opportunities to Improve Your Content
So, with your ContentWRX score, you receive a single metric that speaks to the effectiveness of your current content state. But how do you know where your opportunities lie, and where your content can get stronger?
The Recommendations tab could be your answer. It breaks down your content by dimension and suggests ways that it can be improved. Within each dimension, ContentWRX displays the questions presented to your site visitors along with the most common responses. This includes feedback captured in open text fields, which can be viewed by clicking “See What They Said.” These responses directly influence the automated recommendations by ContentWRX.

This takes the guesswork out of creating more effective content and an overall better experience for your visitors. With ContentWRX, there’s no digging to find a solution. Your content’s strengths and opportunities for growth are brought right to the surface, and you’re provided advice on how to leverage proven strategy to improve your content.
Taking a Deeper Dive
For even more data on your current state of content effectiveness, dig deep into the other tabs:
Breakdown: Use this tab to discover how your content is viewed on different devices and demographics. Under this tab, there are three sections: Device, Demographic, and Page/Screen.
Device: This section will show how your content performs on each device. ContentWRX will display a score based on the responses and analytics from visitors using each device. You can also find information on the percentage of respondents from each device and how much time visitors from each device spend on a page (on average).

This insight can be helpful in determining problems areas on specific device sizes. You may find that you have a high score on a desktop but a low score on mobile. This could be for a variety of reasons such as the content doesn’t display properly on mobile, the navigation is poor, or text is harder to read.
Demographic: This section will show the same metrics, but split into different demographic groups. These demographic groups are defined during the setup process of ContentWRX and reflect the different user personas your content reaches.

Each of these user personas may have different uses for your content, so it’s important to understand how your content is meeting those individual needs. Using this breakdown, you can analyze how content is perceived across each type of user. You may find that your content meets the needs of one group but not another.
Page/Screen: This last section breaks down content effectiveness by page (URL). Here you can take a closer look at how your content is perceived across the most frequently viewed pages or screens on your website. Again, a score is displayed for each page/screen. You’ll also find a quick indication of how this content contributes to perceptions of individual content dimensions, such as Discovery or Accuracy.

Sentiment: On this tab, you’ll see the overall sentiment expressed by your site visitors and what’s driving positive or negative experiences. This tool can be used to look at common words or themes visitors use to describe your content.

A word cloud compiles the most used words that visitors answered to a specific question on your survey. These clouds are split into three categories:
- What drove negative experiences?
- What drove neutral experiences?
- What drove positive experiences?
By answering these questions, you can better understand not just where your content generates “wow” moments or connects with users, but also what elements of your content contribute to poor perceptions. This will help you pinpoint strengths and weaknesses within your current state, and better focus your strategy on how to improve.
Start Making Informed Content Decisions with ContentWRX
Using ContentWRX, you can clearly gauge the effectiveness of your current content and start making informed decisions about future strategy.
There’s no guesswork around what type of content works. You get direct answers from visitors on your site, which is then turned into a content effectiveness score that you can use as a benchmark to continue measuring against.
Even better? ContentWRX also provides recommendations on how you can improve, which makes identifying the strengths and opportunities within your content remarkably easy, and puts your content’s effectiveness into focus.
Events, Resources, + More
5 Secrets of Content Ops Success: Webinar
Learn how the most successful organizations scale and mature content operations. Based on our research with 700+ content leaders and professionals.
The Ultimate Guide to End-to-End Content
Discover why + how an end-to-end approach is critical in the age of AI with this comprehensive white paper.
The Content Advantage Book
Learn more about the much-anticipated third edition of the highly rated book by Colleen Jones. Preorder the electronic version.
20 Signs of a Content Problem in a High-Stakes Initiative
Use this white paper to diagnose the problem so you can achieve the right solution faster.
Workshop: Are You Ready for AI?
Is your organization really ready for AI at scale? Let the Content Science team guide your leaders through assessing 4 areas of readiness.
Upskill with Content Science Academy
Training for modern content roles through on-demand certifications + courses or live workshops.


Comments
We invite you to share your perspective in a constructive way. To comment, please sign in or register. Our moderating team will review all comments and may edit them for clarity. Our team also may delete comments that are off-topic or disrespectful. All postings become the property of
Content Science Review.