
If you aren’t using analytics to help improve the content you’re putting out, you could be missing out on major business opportunities. Whether you are trying to sell ad space, products, services, or some combination of the three, creating effective and compelling content is crucial to commercial success today.
At Keen.io, we specialize in event-data analytics, so we definitely appreciate the need for comprehensive content analytics to help shape our digital content. However, deciding on and implementing an analytics stack can be challenging with more and more tools popping up every day. Below, I dive into some of the key areas of content analytics that we found are critical to our success and a few examples of tools that can help address these areas.
Before we get to that, let’s discuss what content analytics are, and why you should be tracking them in the first place.
What Are Content Analytics?
According to Gartner, content analytics refers to “a family of technologies that processes digital content and user behavior in consuming and engaging with content, such as documents, news sites, customer conversations (both audio and text), and social network discussions.”
Content analytics is the breakdown of data related to user behavior when it comes to engaging with and consuming digital content. Link clicks, scrolls, searches, app downloads, newsletter sign-ups—all of these actions are events that hold important data. Using content analytics tools, a company can take all of that data related to usage and performance on its digital properties, and display it in an actionable and understandable way.
Why Use Content Analytics?
“Business today is digital. That makes content critical,” Colleen Jones notes in The Content Advantage. Every business function, from support to product to marketing, relies heavily on content. For instance, 91% of B2B marketers and 86% of B2C marketers identify content marketing as key to their marketing programs.
To make content a competitive advantage, content analytics are critical to identifying opportunities to improve your content strategy. Content analytics can tell you how your audience is consuming and engaging with your digital content. From making a purchase to subscribing to your newsletter—these actions all help to paint a picture of how well your content is performing online and offer clues as to how to improve your results.
Top Content Analytics Tools
To get a comprehensive view of your content analytics, an effective marketing analytics stack is critical. Below are some key categories of content analytics to consider when identifying your ideal set of tools.
1: Understanding Your Traffic Drivers
Driving visitors to your website is a top priority for generating awareness and interest in your product. In order to understand site traffic patterns and identify ways to increase traffic, we use the following tools.
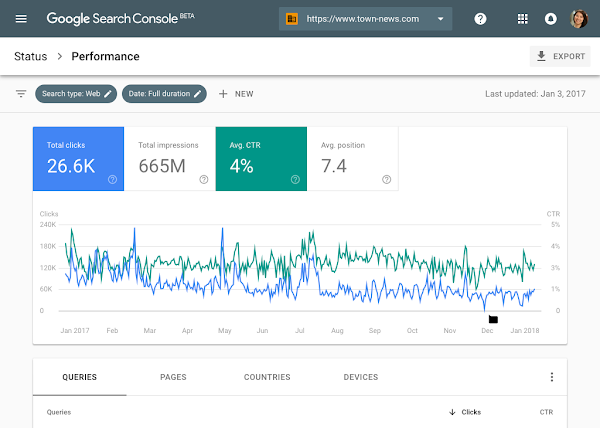
Google Search Console
Google Search Console is a tool you can use to measure your website’s search traffic, impressions, click-through-rate, average search ranking, which queries bring users to your website, and more. It also allows you to test your website’s mobile usability, which is critical for your success since websites that are mobile-friendly are favored by Google in search rankings.
With Google Search Console we gain instant insights into how our content is performing. We can look at the historical click-through rates, impressions, and even see the raw data related to what visitors were searching for that led them to our blog. We use these insights to optimize and update older articles to improve performance. The easiest place to start is checking out what queries are leading visitors to land on your articles. Then, take that information to update your posts to include those keywords and related keywords to attract even more potential customers.
This knowledge also gives you a starting point for future posts. After all, if people are searching for specific things that lead them to your site, your future posts should address those queries. In other words, seeing the actions visitors are taking prior to landing on your content tells you exactly what content you should be giving them.
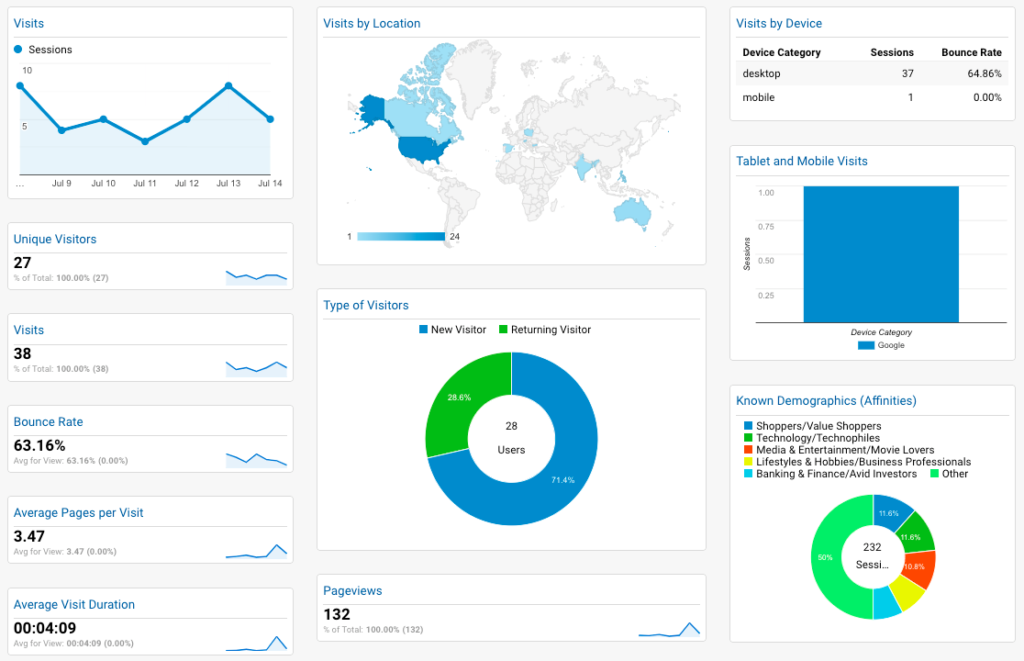
Google Analytics
Google Analytics, when used in combination with Google Search Console, will give you even more information about your website, how it is performing, and how people are finding it. Google Analytics is a tool you can use to build a more complete picture of your website users. Just a few of the metrics tracked via Google Analytics are traffic source (i.e. organic search, paid search, social media, and so on), the average time on the website, demographic information on your visitors, bounce rate, and total number of site visits.
There are a lot of ways to use this tool, such as tracking trends in where your visitors are coming from. For example, if you are seeing a decline in paid social media traffic but no change in budget, perhaps it could be due to a new campaign that isn’t as relevant to your target audience. Another way to use Google Analytics is to monitor your bounce rates. If they are high, it could mean that when people get to your page, they are not finding what they are looking for. This could be an indication that the content on these pages needs an overhaul to increase its relevance to the reader. Lower bounce rates also boost your search rankings, which could improve your visibility to potential visitors.
2: Identifying Areas for Content Optimization
At Keen, we use additional content analytics tools to help diagnose specific areas of improvement for our website design and content.
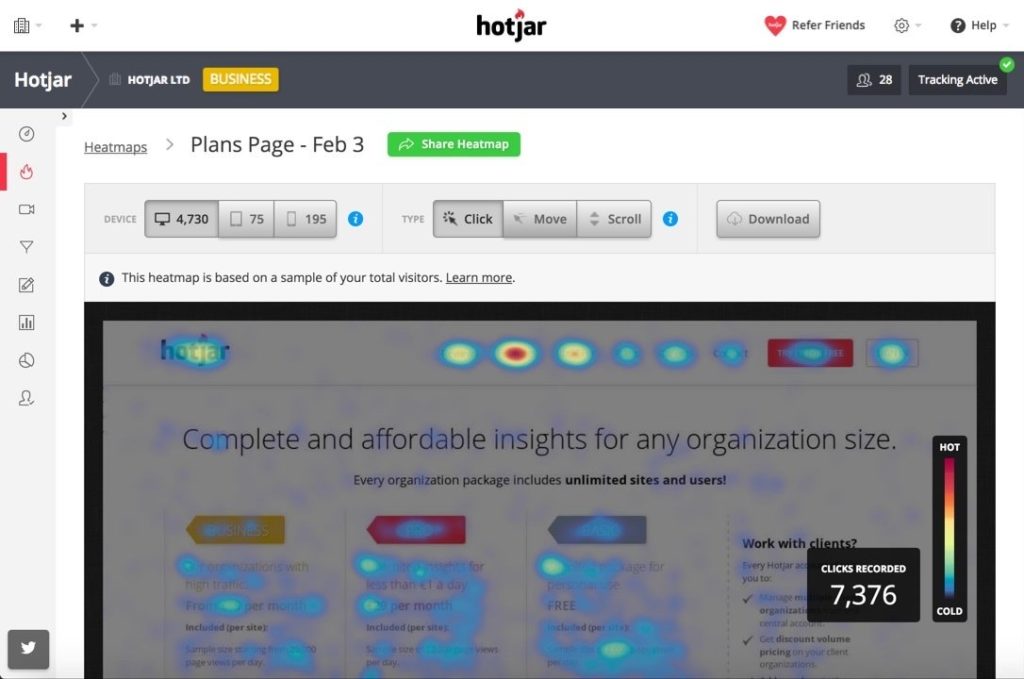
Hotjar
Hotjar is a tool that uses heat mapping, session recordings, feedback pop-ups and surveys to understand the behavior of your website users. Heat mapping gives you an inside look into how readers are scrolling and where they are clicking on the page. Session recordings actually give you the ability to watch random anonymous user sessions on your website to see where users may get stuck, click somewhere else, or even abandon your page entirely. Hotjar feedback pop-ups also allow you to ask your users a question as they attempt to exit your page. Finally, you can send a survey that allows respondents to go more in-depth with feedback about how they feel about your website.
Using the Hotjar heat mapping tool, we were able to see how far down the page a typical visitor would scroll. Then, we made sure that our primary call to action occurred prior to the majority of drop-offs. We were also able to identify a potential gap in our content where visitors were losing interest, which informed a reorganization of our content so that more relevant information came first.
3: Keeping An Eye on Your Content Competition
Content marketing is getting more and more competitive. Content does not live in a vacuum, and therefore, it is important to have content analytics tools in place to monitor how you stack up against your key competitors.
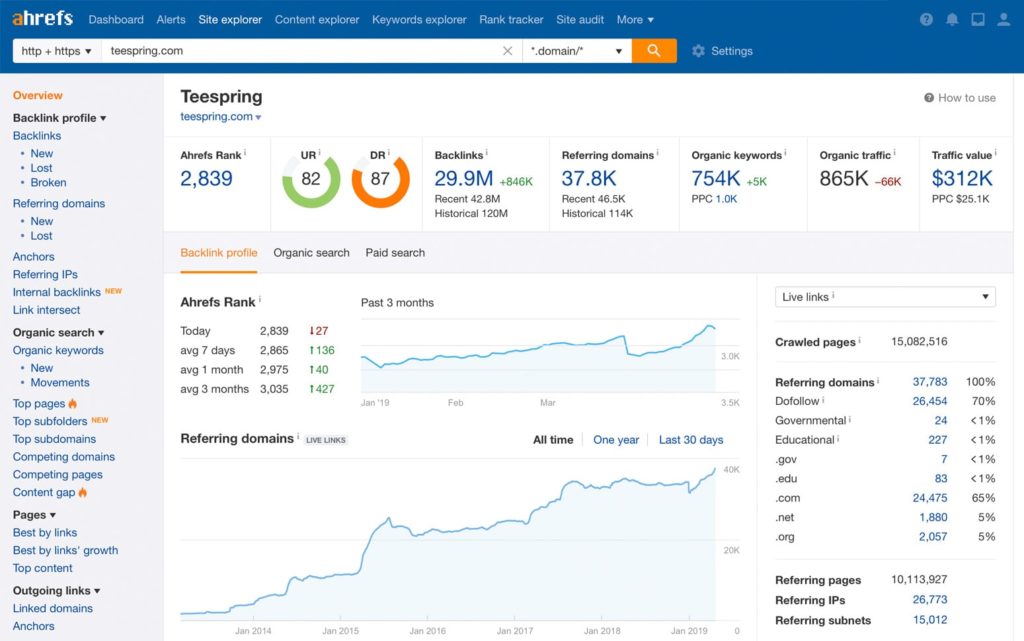
Ahrefs
Ahrefs is a content analytics tool that helps analyze keyword search volume and keyword difficulty. Keyword search volume refers to the number of searches for a keyword or phrase in a given period of time. Keyword difficulty refers to how difficult it would be for a new website to rank for a keyword or phrase in search. This information is beneficial in content creation because if you are using keywords or keyword phrases that have low keyword difficulty, it will be easier for your website to rank higher in search engine result pages (also called SERPs).
One of our favorite features of this tool is the ability to create a content gap analysis. By simply inputting our blog URL as well as the URLs of our competitors’ blogs into the platform, we can run a report showing where the competition is ranking in the top 10 search results and where we are not.
When you create this analysis you’ll get first-hand knowledge about where your blog is lacking in comparison to your competitors. Armed with this information, you can go back and create new pieces of content optimized with better keywords to improve your search engine rankings. With any luck, you can quickly surpass the competition.
4: Understanding Content Effectiveness Faster
With all of the content analytics tools and resources available, it can be easy to get overwhelmed. Employing tools that help automate insights can help your team get to the insights faster, so you can spend more time on action than analytics.
ContentWRX
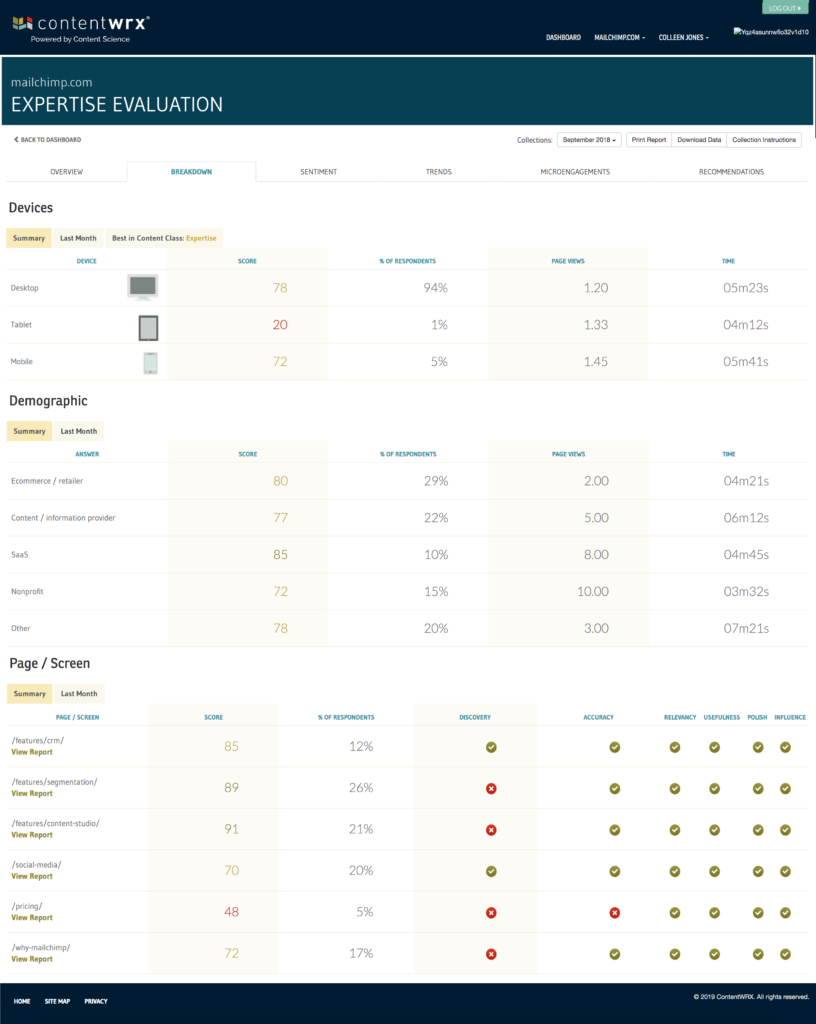
The patented ContentWRX system offers unique features that take the hassle out of understanding and predicting content effectiveness. It enables you to collect, analyze, interpret and ultimately act on data in line with your goals, which could relate to sales, support, branding, or thought leadership.
Micro-engagement analytics evaluation at section, page, component, and app levels—coupled with survey feedback—is used to generate a content score for your website. This can be tracked over time, and compared against industry benchmarks.
ContentWRX has some wonderful case studies on its website that show how users have benefited from these content analytics evaluations. One we recommend reading in particular is the American Cancer Society case study. The nonprofit relied on print-based marketing materials for years, but using ContentWRX showed them how to transform these into the web-ready articles and posts that their ideal readers were looking for.
Think You Don’t Need Content Analytics Tools? Think Again
The content analytics tools mentioned here today barely scratch the surface of what’s available to make your content creation strategy even better. Regardless of which tools you choose, it’s critical that you begin analyzing your content sooner rather than later to identify missed business opportunities.
Events, Resources, + More
New Data: Content Ops + AI
Get the latest report from the world's largest study of content operations. Benchmarks, success factors, commentary, + more!
The Ultimate Guide to End-to-End Content
Discover why + how an end-to-end approach is critical in the age of AI with this comprehensive white paper.
The Content Advantage Book
The much-anticipated third edition of the highly rated book by Colleen Jones is available at book retailers worldwide. Learn more!
20 Signs of a Content Problem in a High-Stakes Initiative
Use this white paper to diagnose the problem so you can achieve the right solution faster.




Comments
We invite you to share your perspective in a constructive way. To comment, please sign in or register. Our moderating team will review all comments and may edit them for clarity. Our team also may delete comments that are off-topic or disrespectful. All postings become the property of
Content Science Review.