
Editor’s note: This is part three in a three-part series that explains machine learning for content automation. Read part one here and part two here.
Wouldn’t it be amazing if your content optimized itself as it was being delivered? That’s exactly the promise of machine learning– and with personalization rules correctly configured it should also be the reality. What’s more, if you plan well, you can gain insights—or human learning—to inform your content strategy moving forward.
In the previous articles in this series, we’ve touched on the importance of measuring your content’s performance as you’re automating its delivery. It’s always important to understand content’s contribution to business outcomes since it makes the case for the value of content operation to your organization.
However, measurement and evaluation are even more valuable when viewed as drivers of insight that can inform your content strategy. In this article, we’re going to look at the ways you can achieve this, using the data you’re collecting while automating personalized content.
Let’s begin with breaking down the levels at which you can measure automated content.
Different Levels of Measurement
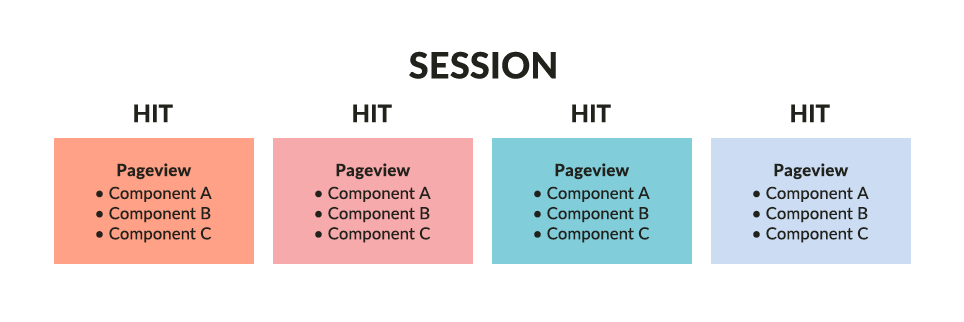
Website content performance is usually collected on three levels: the audience (users), the session (visits), and the hit (page) level. Data collected on these three levels are appended together to get a full view of what your users do with your web content. However, since your automated content is designed with components, your hit-level data exists on both the page and component level. Each of these levels provides the opportunity for unique insight.
The audience level is discussed in detail in part one of this series. What we’re trying to determine is our users’ intent – how does the data that we collect about our users inform us of their goals with our content? Voice of customer tools like ContentWRX can allow users to explicitly state their goals for using content, but this can also be inferred by creating user cohorts based on the behaviors of similar users, as described in part two of this series.
Now let’s take a deeper look at the other two levels at which we collect data and how this data can help optimize your content.
The Session Level
 Session-level metrics are probably the most commonly understood among most content stakeholders. Your traffic is the number of sessions to your site over a period of time, and you calculate engagement with your content using metrics like pages per session, average session duration, and bounce rate (the percentage of sessions consisting of only a single pageview). These metrics are extremely useful for understanding your content’s performance, but there are additional insights that can be gained by looking at content sessions.
In part two, we covered the importance of optimizing content paths toward valuable behaviors using the Best Next Customer Experience approach. You should be measuring these valuable behaviors using a metric such as a Goal Conversion or Custom Event in your web analytics tool or using a content effectiveness tool like ContentWRX to measure valuable microanalytics. Looking at the number of sessions that result in one of these valuable behaviors, compared to the total number of sessions overall, gives you a conversion rate for your content.
Understanding what percentage of your sessions results in behavior that’s both valuable to your business and your users helps you understand the efficacy of your content automation. Are the personalization rules your content engineer put into place making your content more useful for your users? Comparing this metric to periods prior to content automation helps you understand the difference this process has made in your performance. If it hasn’t improved things, you know you need to take a closer look at your goals and how your content is performing.
You can also segment your session-level data to get a better understanding of which content is performing well, and for which users. If you’ve used custom variables or tagging to define which content should be grouped together (based on sections of your site, user journey stages supported, audience targeted, or any other useful segmentation), you can segment based on these parameters to get high-level insights into content performance.
At the session level, you want to understand how many sessions ultimately resulted in a valuable behavior. Do sessions that result in a valuable behavior seem to begin in any particular section of your site? Do users who convert seem to be viewing content supporting one journey stage over any other? Understanding the answers to these questions will get you closer to the truth of what’s driving your content’s effectiveness, and how to replicate your successes across the entire scope of your content.
Finally, when using a Voice of Customer tool to collect perceptions of your content’s effectiveness, this data is usually reported on a session level. This data reports the effectiveness of users’ entire content experience. What percentage of user sessions resulted in a positive experience? A negative one? What are the elements of your content that are driving those experiences, and what do those common themes tell you about how to adjust your strategy?
Looking at content effectiveness data from the session level provides a 10,000-foot view of content effectiveness, important in understanding the overall impact of your automation and personalization efforts. However, to really understand what’s driving that impact, you’ll need to dig into the hit-level data.
The Hit Level
As discussed, when utilizing components to enable content automation, your hit level data really exists across two levels: the page and the component.
Page-level data is important because it provides you with more information about the content requested by your users. This aligns with their intent and gives you insight both into the type of content users most frequently look for and how they navigate your site. Two important metrics related to navigation are Entrances and Exits.
Entrances measures what pages users enter your site through. This metric reveals a tremendous amount about the types of content people visit your site to find. This is especially useful when segmenting your traffic by sources or acquisition channels.
Search entrances, for example, provide insight into what users search for when keyword data is not available. You can also use this data to understand search engine optimization efforts at your organization. Are the phrases and/or topics you’ve focused on with your SEO strategy producing a lift? What’s working, and what isn’t?
Direct entrances are also worth paying close attention to. This metric can show which types of content your users bookmark, which can indicate that they find this content particularly useful. One important element of direct traffic to consider is that users who enter your site directly on a page besides your homepage will probably be looking for specific content. If a returning user directly requests a specific page, consider setting personalization rules to deliver the content components this user previously viewed on the same page.
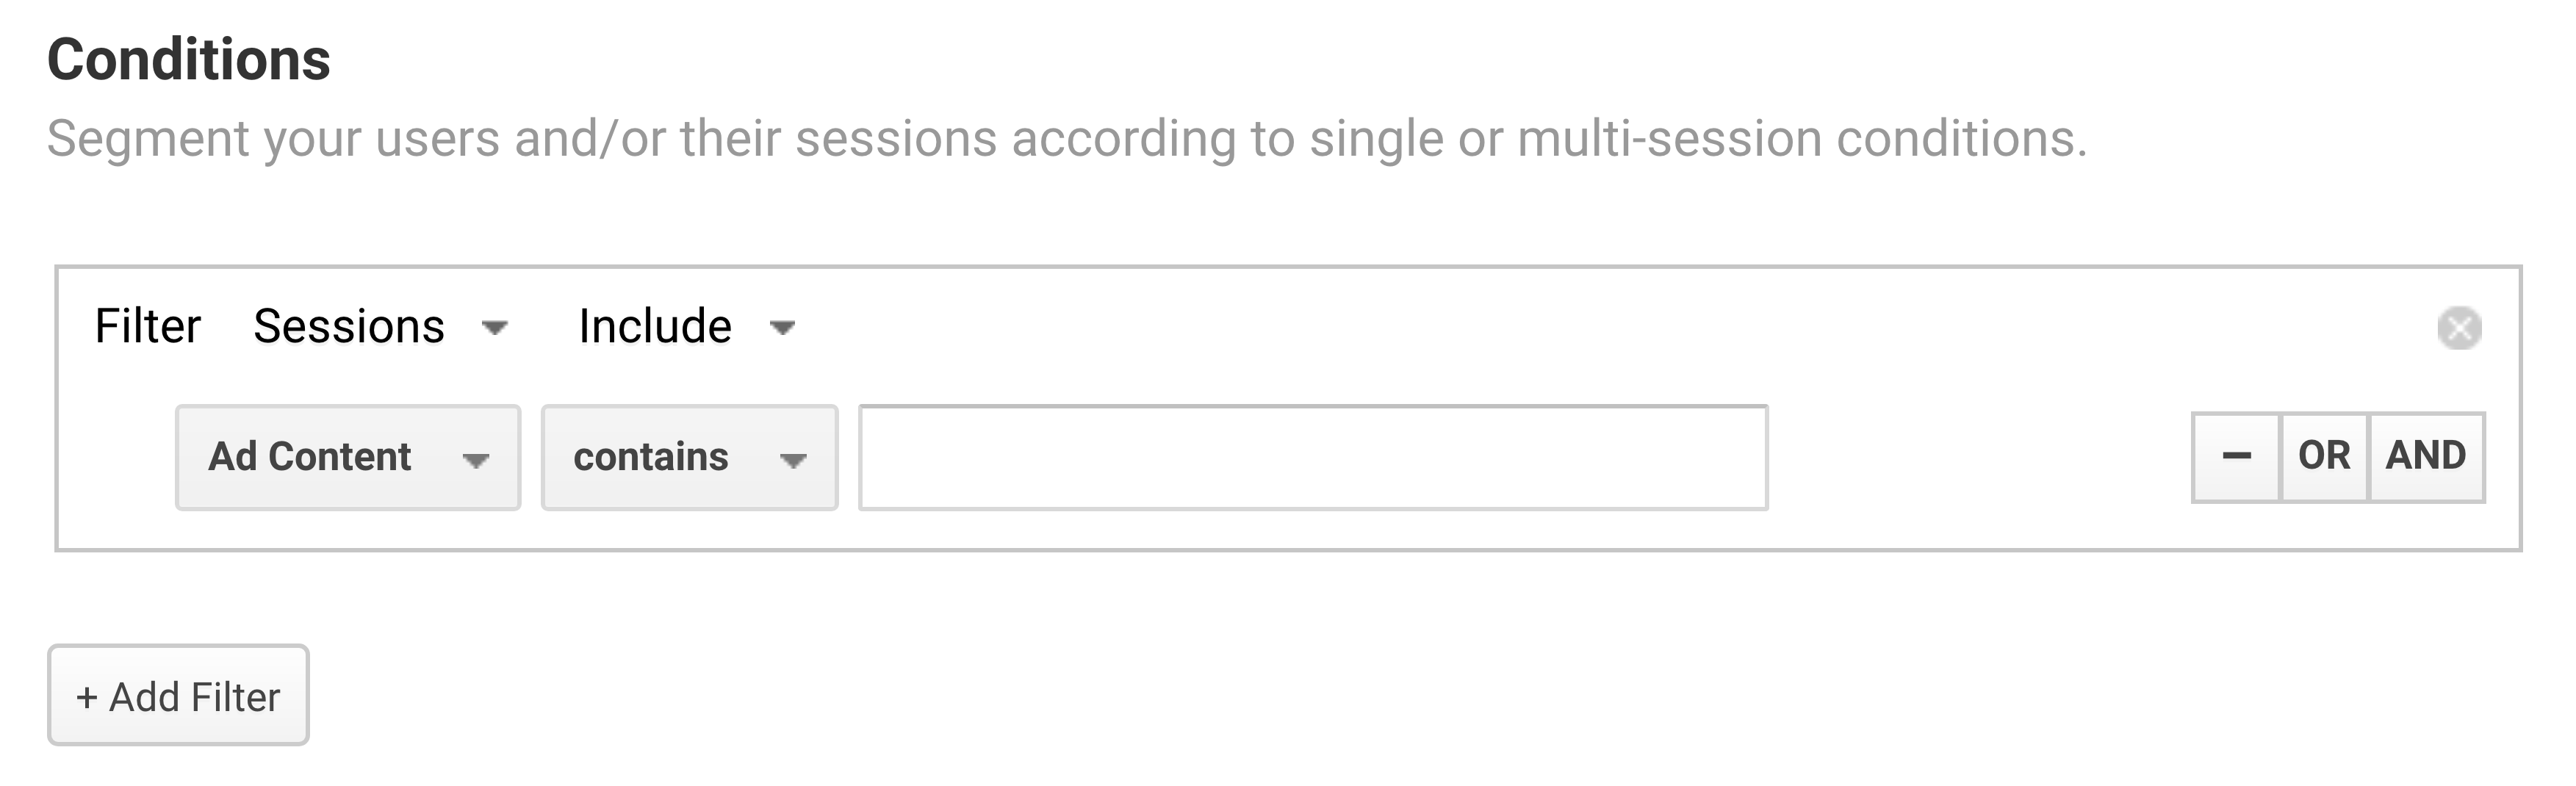
Exits, on the other hand, indicate the number of times a session ended on a page. Before extrapolating too much from this metric, you’ll want to look at in relation to the valuable behaviors you’re pushing users towards. Create a Converting Sessions segment, capturing all sessions in which a valuable behavior was performed, to see whether users accomplished their goals before leaving your site.
If users have not accomplished their goals or performed a behavior that is valuable to your organization, Exits can help you understand where users get frustrated and abandon their goals. A high exit or bounce rate for a page without the presence of goal completions can indicate issues with this content. Review the content on these pages, including their layout, to determine why users might be leaving your site after viewing it. Is there anything different about these pages than those with low exit rates?
One reason why these issues may occur is technical performance. Understand how individual pages perform using metrics such as Page Load Time or System Errors. While the former is a standard metric in web analytics tools, some tools will require you to create a Goal or Event for the latter. A high incidence of either of these occurring on one page may indicate that this page has not been optimized for automated content delivery.
Finally, you’ll want to understand which components are most commonly being served on each page. This will give you insight into the types of users looking at this page and the goals this page commonly supports. Setting rules for which components load on which pages is part of your personalization rules setup, but if you see something abnormal here you know that these need to be reviewed and updated.
Component-level data is similar to page-level data, but even more specific. You will track the use of individual components using either one of your web analytics tool’s custom variables or URL tagging. Many of the metrics most commonly associated with pages – such as Average Time on Content, Views, and Bounce Rate – will be hugely important for components, as the components represent the actual content viewed on the page.
Depending on the types of components you’re using, you may want to set up custom events to measure interactions with individual components. Since an individual component may be delivered on multiple pages, capturing clicks using an Event that captures the page and component ID will help you understand which components your users interact with. Some examples here include quizzes, games, or forms your users can click on and interact with, or video components for which you want to measure views and the amount of the video watched.
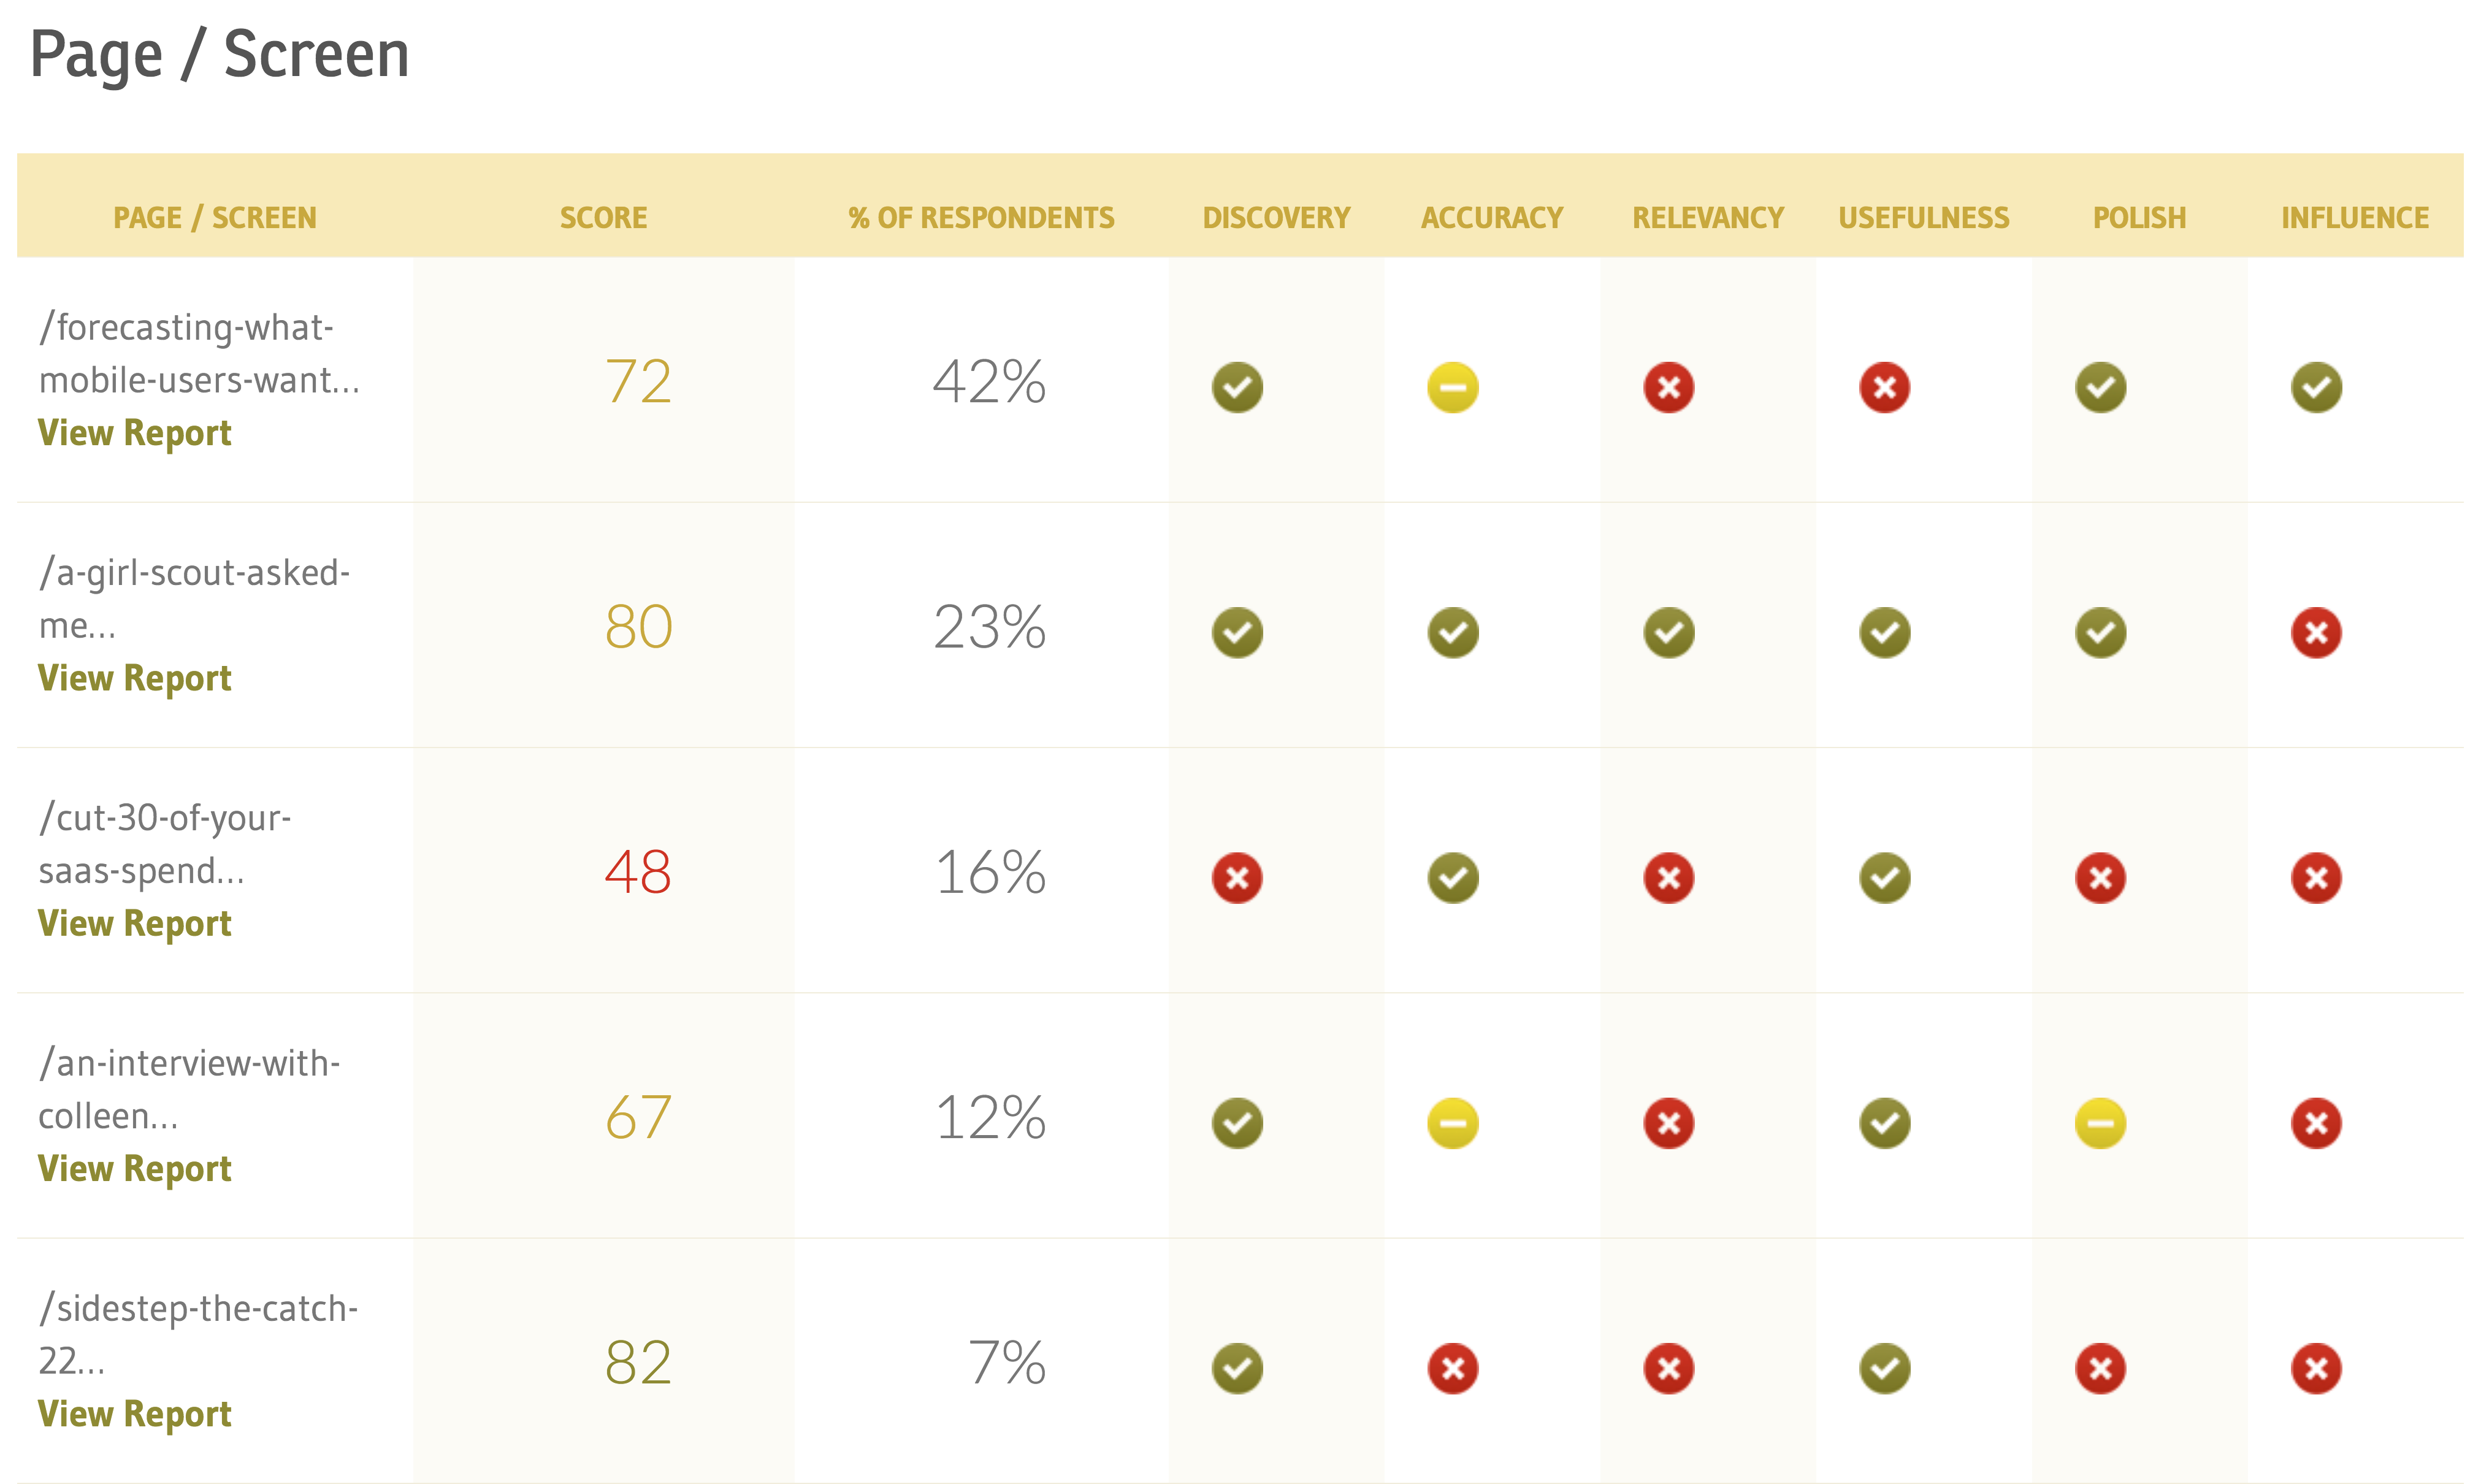
This type of microanalytic data can also be captured using a content effectiveness tool like ContentWRX (see screenshot below). This tool also captures user perceptions of content effectiveness and can report on how individual pieces of content affect overall perceptions of your content experience. This can be accomplished at either the page or component level.
Understanding the insight you can gain by looking at different levels of content data is only the first step towards optimizing your content. Now, let’s look at some processes you can use to optimize the automation of your content.
Understanding How Your Content Technology Helps You Optimize Your Content
In part two of this series, we touched on how machine learning-enabled content technology uses an iteration of the Gale-Shapley algorithm and association rule learning to identify and deliver the content most likely to meet user needs and produce value for your organization. Because the content technology references your content’s performance data, it optimizes your users’ content experience by delivering content that is consistently high-performing.
What constitutes high-performing content is up to you to decide, and the specific metrics that signal success are referenced in the rules written by your content engineer. However, the content technology operates as a completely impartial arbiter by using those metrics to decide which content to deliver most frequently.
As a result, machine learning-enabled personalization can actually make determining which of your content is and is not effective a much easier project. When reviewing your overall content performance, the delivery rate for different pieces of content across your site will let you know which content is being shown to your users most frequently, which should correlate with the highest rates of effectiveness across other metrics. The delivery rate formula is simple:
Delivery Rate = | Number of Times Content Has Been Delivered |
Number of Potential Deliveries |
Of course, you never want to rely entirely on a single metric to determine whether your content is effective, so be sure to look at other metrics, like conversions contributed to, time on content, interactions with the content, etc. before treating delivery rate as the best method for evaluating content. Looking at these additional metrics will allow you to validate that your CMS is correctly configured to automate content by delivering the most effective components more frequently.
The most effective way to view which content is performing well is to conduct a content audit. Form a complete inventory of all your content components and include any relevant data about that content that helps to identify its purpose. In part one of this series, we outlined several pieces of content-related data that are important to have in place prior to beginning content automation. You may lay this out like so:
| Content ID | Type | Target Persona | Journey Stage | Content Source |
|---|---|---|---|---|
| A733IAD | Video | CMOs | Initial Research | Content Science Staff |
| X126LOT | Text | Strategists | Compiling Recommendations | Content Science Staff |
| D339PQR | Text | Designers | Initial Research | Content Science Staff |
Once you have all the data that helps you identify content populated, add the data that indicates effectiveness – in this case, your content components’ delivery rate. This will allow you to see which content users are being served, and begin to ask important questions like:
- Which content is being prioritized by your CMS?
- Which content is being phased out of delivery and why?
Understanding what content is performing well helps you understand the strengths of your content. Review your highest-performing content and look at the similarities between different pieces. Are there common traits these pieces share that are repeatable in other facets of your content? Do the same for your low-performing content, as this will help you understand the opportunities to improve your content.
If you are collecting perception data on your content, referencing this can help you understand why users are taking certain behaviors. You’ll specifically want to review any voice of customer data collected from users who viewed your lowest performing content. This feedback can help uncover any problems they experienced with the content or any elements that they found ineffective or unsatisfactory.
The content tags and metadata you’ve compiled for your automated content can allow for even greater insight into your content’s performance. When conducting your audit, this data helps you better understand how all content with similar messaging and target audiences are performing. You’ll want to look at the performance of all content across a few additional segments:
- Performance on different devices
- Performance with users from different sources/acquisition channels
- Performance within certain demographics/user profiles
Deep segmentation offers more insight into the specific content that resonates with your audience. Since your content is being automated and its delivery optimized in real time, you don’t need to rely on metrics like pageviews that can inflated by lost or irrelevant users. Because your data is this segmented, you can go far beyond what’s typically possible in a normal content audit.
Once you’ve segmented your delivery rates across each of these dimensions, look at all the content within a specific tag (such as unique topics). Ask questions like:
- Do you have redundancies in your content set? Is there any content that is unnecessary, given the delivery rates of other content of the same type, topic, etc.?
- Is there any content whose performance is drastically different on different devices?
- How does the content aimed at specific user personas perform with those users?
- Are there particular types of content that seem to produce the most valuable behaviors?
- Do specific topics perform especially well? What about content supporting the needs of specific personas or journey stages?
Asking questions like these can help you identify content to condense, archive, or retire, and where your content needs expansion. If you have a lot of content that supports a particular journey stage or covers a specific topic and much of it isn’t being delivered by your CMS, you can ask whether you need to continue maintaining this content.
However, content of a distinct type that’s frequently delivered should indicate your users find it especially effective. Your insight-informed action plan for content strategy can include specific items like, “X content of type y is delivering z outcomes to d users, so we need more of this content for our other users.”
Backing up your recommendations with data that supports them is the best way to build credibility for a content strategy approach. With machine learning-enabled content automation, you have the extra benefit of the data being aided by an impartial artificial intelligence optimizing delivery for increased effectiveness. Using AI to help you quickly identify which content is working for your organization makes identifying your strengths and opportunities even easier.
This concludes our three-part series on machine learning for content automation and personalization. I hope it has been eye-opening regarding the possibilities for content that are still evolving today, and how processes like machine learning are making content an exciting field to be in. With the right data, the right tools, the right people, and the right processes in place, machine learning can truly improve the job of content: meeting the needs of customers and users while achieving valuable goals for businesses.
The Authors

Andrew Johnson is a former senior content analyst for Content Science, the end-to-end content firm company behind ContentWRX, Content Science Review, and Content Science Academy. Currently with The Home Depot, Andrew has worked with a wide range of organizations to define and measure content effectiveness and to empower enterprises with content intelligence. Andrew holds data and analytics certifications from leaders such as Google and the Digital Analytics Association.
Content Science partners with the world’s leading organizations to close the content gap in digital business. We bring together the complete capabilities you need to transform or scale your content approach. Through proprietary data, smart strategy, expert consulting, creative production, and one-of-a-kind products like ContentWRX and Content Science Academy, we turn insight into impact. Don’t simply compete on content. Win.
Events, Resources, + More

New Data: Content Ops + AI
Get the latest report from the world's largest study of content operations. Benchmarks, success factors, commentary, + more!
The Ultimate Guide to End-to-End Content
Discover why + how an end-to-end approach is critical in the age of AI with this comprehensive white paper.
The Content Advantage Book
The much-anticipated third edition of the highly rated book by Colleen Jones is available at book retailers worldwide. Learn more!

20 Signs of a Content Problem in a High-Stakes Initiative
Use this white paper to diagnose the problem so you can achieve the right solution faster.
Comments
We invite you to share your perspective in a constructive way. To comment, please sign in or register. Our moderating team will review all comments and may edit them for clarity. Our team also may delete comments that are off-topic or disrespectful. All postings become the property of
Content Science Review.